 |
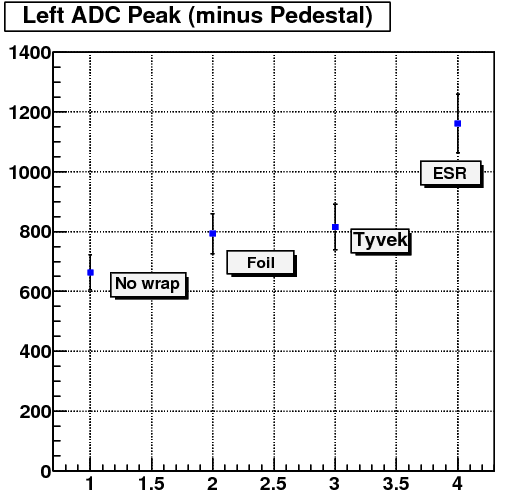
Previously, we have compared ESR wrapping with Tyvek, Aluminum foil
and no wrapping at all. ESR was giving us about 45% larger signal
than either Tyvek or foil (plot on the left). Back then, we didn't
have Mylar to test which we have now. Because of the new trigger
setup and new PMTs, direct comparison with previous measuremnts
cannot be done. So, we measured only ESR and Mylar wrapping under
the new conditions. ADC spectra shown below were taken at HV of 2000V
and 1800V. At 2000V, peak positions are at 1801 counts (Mylar) and
2444 counts (ESR). At 1800V, they are at 1101(Mylar) and 1472(ESR).
Taking into account pedestal position at 267 counts, ESR signals
exceeds Mylar by (2444-267)/(1801-267)=1.42 at 2000V and by
(1472-267)/(1101-267)=1.45 at 1800V. Rescaling ESR peak to its
position in the old measurement will put Mylar peak at about 801
counts on the first plot, i.e., on par with Tyvek.
|


